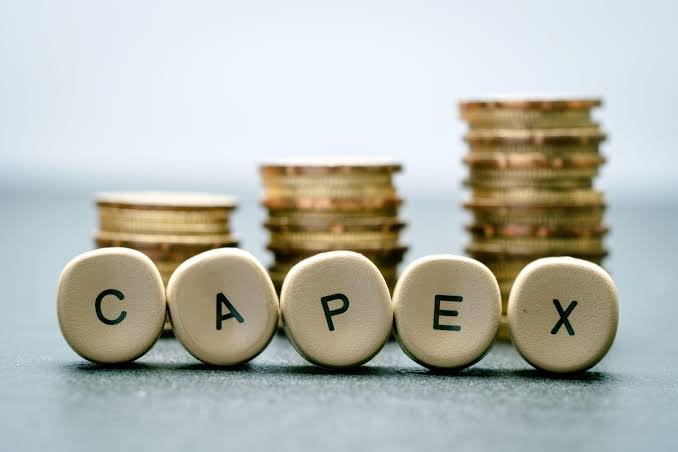
Capital expenditure is the money a company spends on long-lived assets such as factories, equipment, and infrastructure, and the way those costs flow through the financial statements can make earnings look very different from the underlying economics. Understanding the gap between spending and expense is central to judging capital-intensive businesses.
When a company buys equipment, the cost does not hit the income statement immediately. Instead it is recorded as an asset and gradually expensed as depreciation over its estimated useful life. A company can therefore spend heavily in one year while reporting only a small fraction of that cost in current earnings.
This timing difference makes depreciation relative to capital spending a revealing comparison. If a company consistently spends far more on capital expenditure than it records as depreciation, it is either investing for growth or masking a rising cost base that will eventually weigh on earnings as the depreciation charge catches up.
The reverse situation is also telling. A company spending much less than its depreciation expense for an extended period may be underinvesting, allowing its asset base to age while boosting near-term free cash flow. That strategy flatters current cash generation but can erode competitive position and eventually require a costly catch-up in spending.
Estimates of useful life are another source of judgment. Extending the assumed life of equipment reduces annual depreciation and raises reported profit without any change in cash flows, and a lengthening of useful lives across a capital-heavy industry deserves a skeptical look at whether the equipment genuinely lasts longer.
Separating maintenance spending from growth spending clarifies how much capital a business truly needs just to stand still. Companies do not always disclose the split, but multi-year patterns in capital intensity, measured against revenue, can help estimate it.
A helpful metric to track is the ratio of capital expenditure to depreciation over a rolling five-year window, alongside the ratio of capital expenditure to revenue. A ratio persistently above one with stable revenue growth suggests spending that is not yet producing returns, while a ratio persistently below one suggests harvesting. Neither is automatically wrong, since the right level depends on the stage of the business, but a sustained departure from the company’s own history, especially without a stated strategic reason, deserves a direct question to management or a closer read of the filings.
Free cash flow analysis grounded in these details, such as the reporting from BullScope, helps investors see past depreciation-smoothed earnings to what a capital-intensive business actually generates for its owners.